
Walking into a sales gallery feels exciting. The lighting is warm, the scale model looks incredible, and the sales representative offers you free coffee while explaining that the development is 80% sold out. They offer zero downpayment, free legal fees, and cash rebates upon handover. It feels like an offer you cannot refuse.
However, behind the glossy brochures and attractive incentives lies a common pattern in the real estate market: individual buyers consistently buy at retail prices, while institutional investors and seasoned professionals acquire assets at wholesale valuations.
If you purchase real estate purely on emotion, showroom Aesthetics, or developer marketing narratives, you risk falling into the retail trap.
In this guide, we break down the psychological and structural mechanics behind retail property traps, explain why individual buyers make costly mistakes, and present the 31/8 Property Filter Framework used by sophisticated investors to analyze every deal.
The Retail Trap refers to the market phenomenon where individual real estate buyers purchase residential properties at artificially inflated gross prices driven by developer marketing, emotional appeal, and optical discounts (e.g., cash rebates or free packages).
Because retail buyers evaluate properties based on showroom presentations rather than comparative market data, median sub-sale values, and net rental yields, they pay a premium that takes 5 to 10 years for the market to absorb.
When developers launch new projects, they face immense costs: land acquisition, construction, financing interest, marketing agencies, sales gallery fit-outs, and agent commissions. To preserve profitability, these commercial overheads are factored directly into the gross purchase price of the units.
To make these elevated prices palatable to retail buyers, developers introduce “sales packages.” These include zero downpayment structures, absorb legal fees, and offer interior design cash back. While these incentives lower the initial cash barrier to entry, they disguise the true market value of the property.
When the property completes three to four years later, owners discover that neighboring sub-sale properties sell for significantly lower prices per square foot, leaving them holding a negative equity or low-yielding asset.
Retail buyers consistently face disadvantages when purchasing property individually. Understanding these structural reasons is the first step toward protecting your capital.
Retail buyers look at the headline price tag minus rebates and assume they are getting a discount. For instance, if a unit is priced at RM700,000 with a 10% rebate, the buyer believes they are purchasing a RM700,000 property for RM630,000.
In reality, the true market value of comparable completed units in that micro-location might only be RM500,000. The buyer has effectively paid a 26% premium over existing market realities.
Many individual buyers purchase investment properties using homebuyer logic. They prioritize luxurious facilities, grand lobby designs, and high-end sanitary fittings. However, tenants make decisions based on monthly rent affordability, distance to public transit, and proximity to major employment hubs.
An overly lavish condo in an inconvenient location will suffer high vacancy rates, regardless of how impressive the swimming pool looks.
Individual buyers often lack direct access to historical transaction data. They rely on sales brochures or verbal promises from agents regarding future infrastructure development.
Professional investors, on the other hand, analyze actual transacted price data from official sources like the National Property Information Centre (NAPIC) to verify true historical price growth and volume before committing a single ringgit.
A classic mistake retail buyers make is failing to define their target tenant profile or exit buyer persona beforehand. They buy with the vague hope that “property prices always go up over time.” Without checking incoming supply pipelines, local employment growth, or rental yield thresholds, they end up trapped in stagnant assets that drain monthly cash flow.
At FAR Capital, we previously utilized a standard “7 Criteria” checklist to evaluate real estate deals. While effective, evolving market conditions, shifts in interest rates, and changing demographic movements made it necessary to refine our methodology into a more comprehensive assessment tool.
The refined 31 Criteria for Property Investment (Structured into 8 Main Filters) moves beyond basic location checks. It provides a mathematical, star-rated scoring model that evaluates both defensive holding power (cash flow) and offensive capital growth potential.
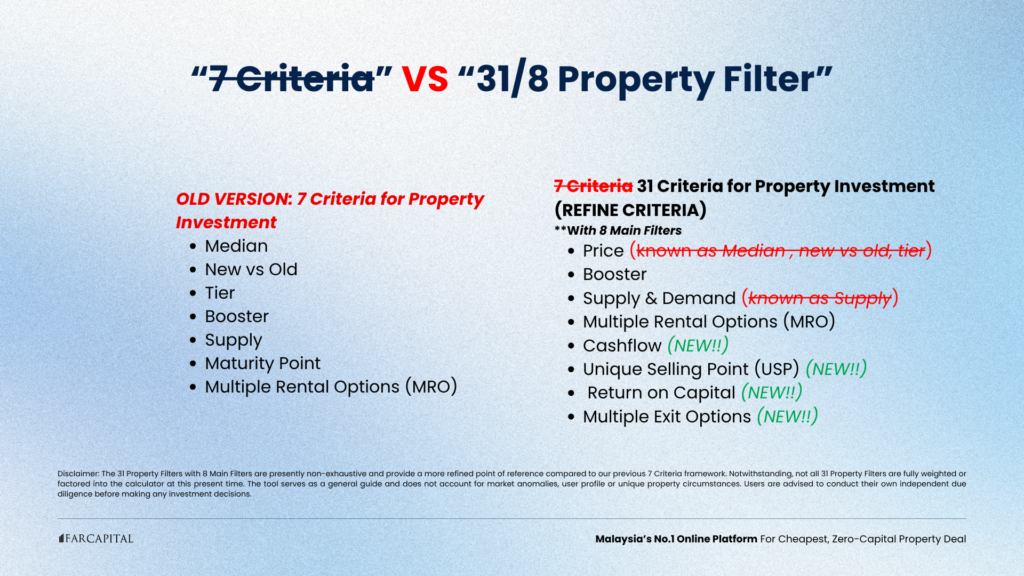
Before buying any unit, institutional investors run the deal through 8 stringent filters. Here is how each filter operates.
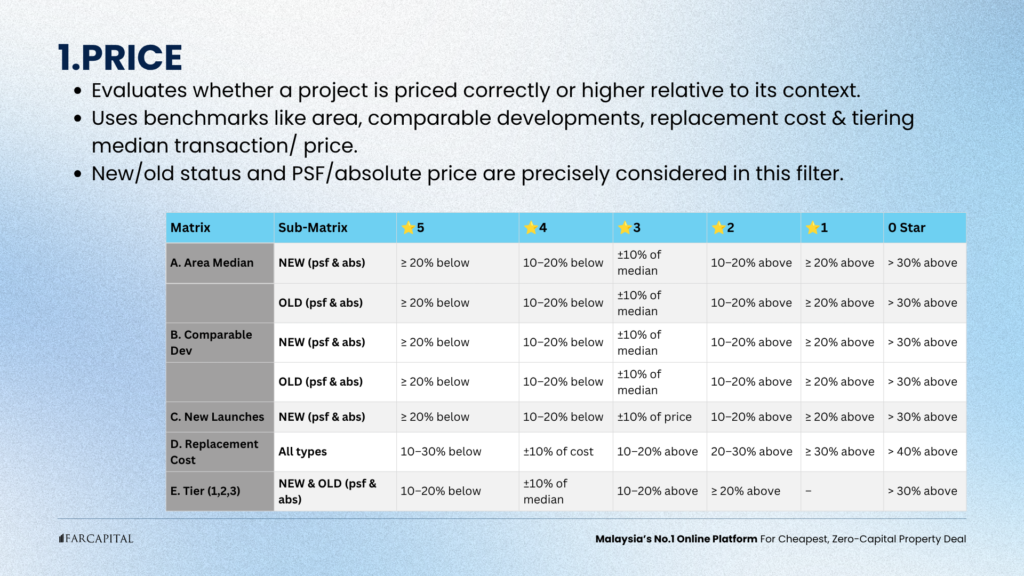
Price analysis goes far beyond looking at the price per square foot (PSF). It systematically benchmarks a project against its local market context across five specific matrices: Area Median, Comparable Developments, New Launches, Replacement Cost, and Tier Classification.
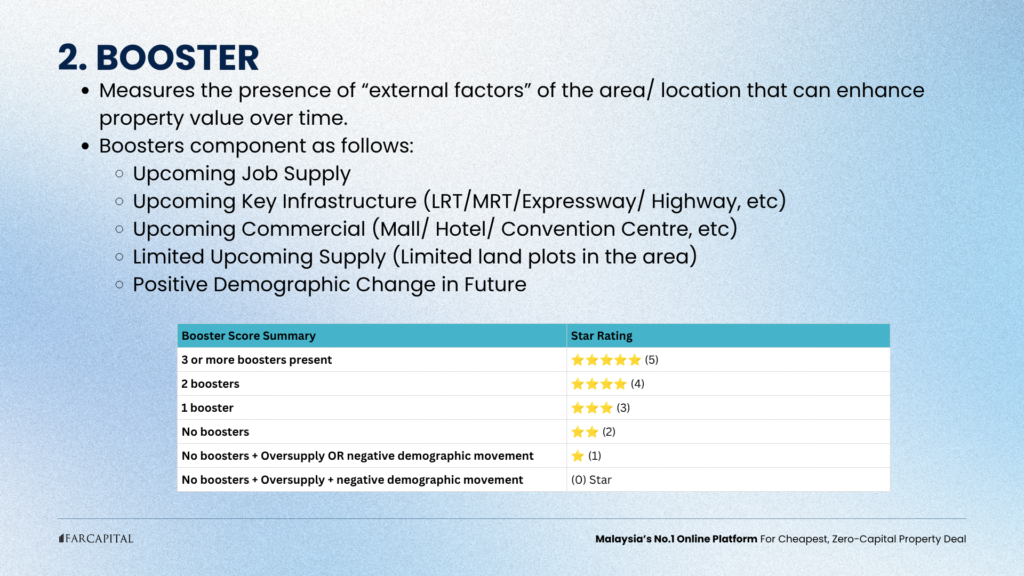
Boosters represent external economic drivers that trigger future capital appreciation and tenant demand growth. A project without boosters will experience price stagnation over long holding periods.
The framework tracks five critical economic boosters:
Scoring Rule: Projects featuring 3 or more strong boosters qualify for a 5-Star Rating. Projects with no boosters facing oversupply or negative demographic shifts receive 0 Stars.
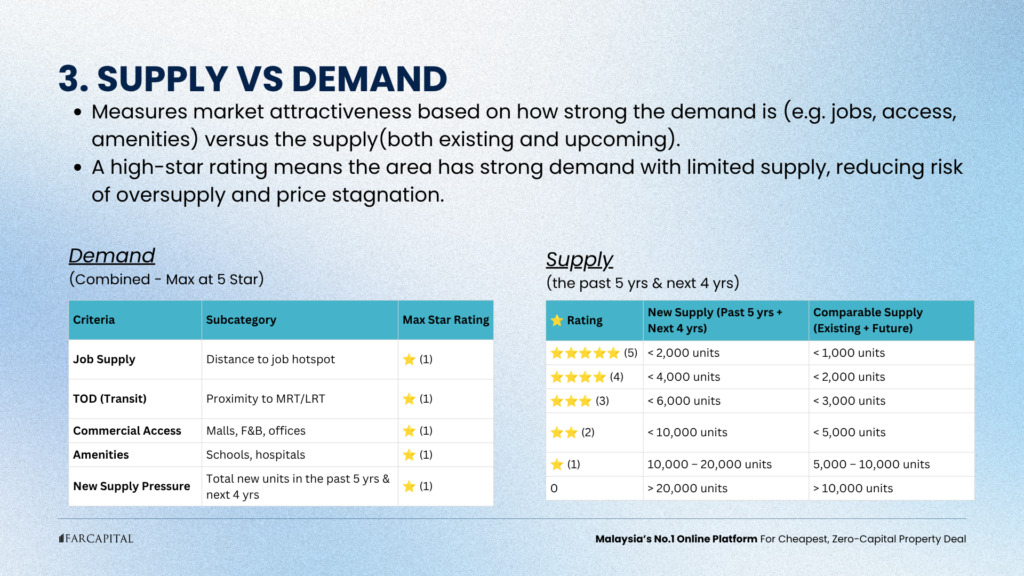
Oversupply is the ultimate killer of rental yields and capital growth. Filter 3 measures local market attractiveness by balancing tenant demand drivers against existing and future unit supply.
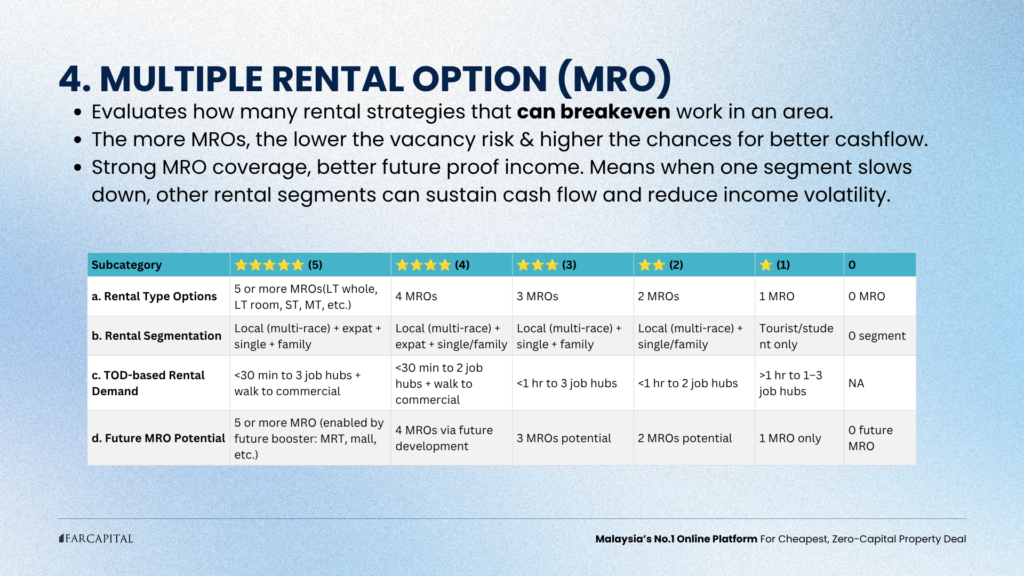
Relying on a single tenant profile exposes landlords to severe income volatility. If that target market experiences a downturn, the unit stays vacant. The Multiple Rental Options (MRO) filter tests how many viable, break-even rental strategies exist for a single unit.
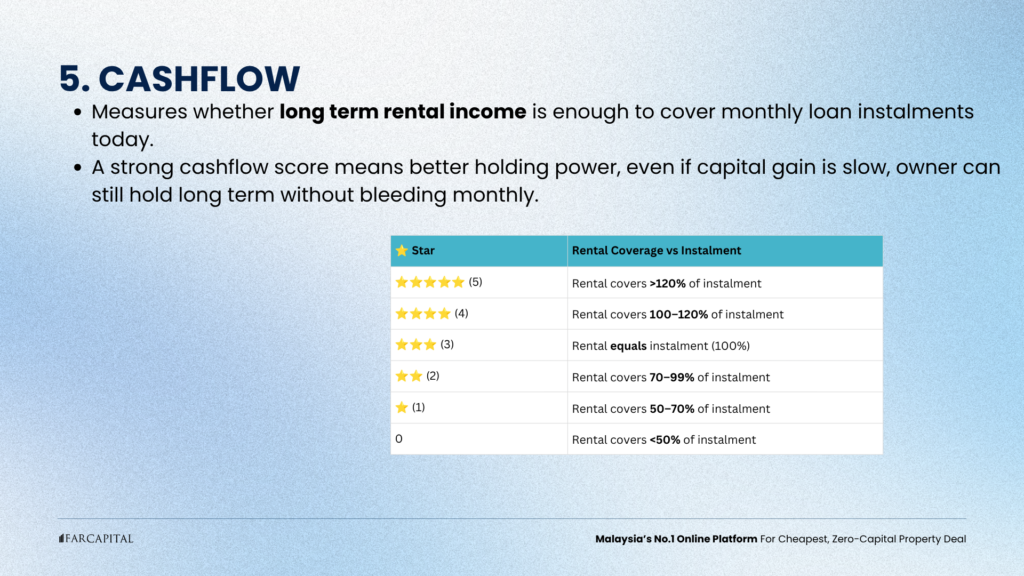
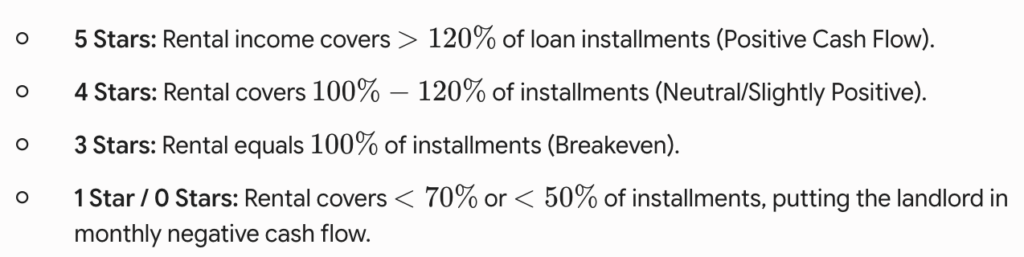
Cash flow determines your holding power. A high cash flow score ensures that monthly rental income covers or exceeds loan repayments, preventing you from injecting personal savings into the asset every month. Rental Coverage Ratio:

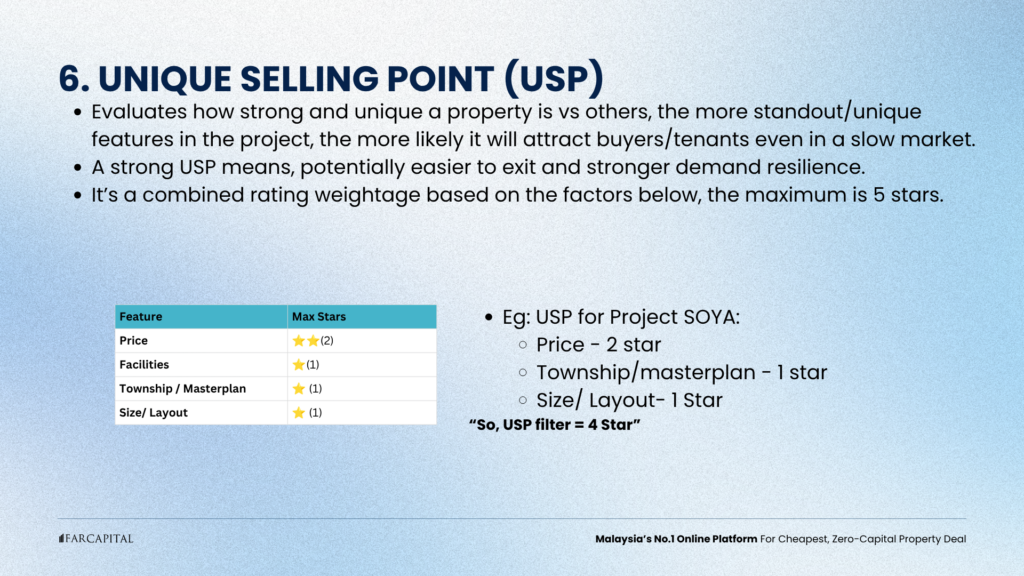
When a tenant or sub-sale buyer looks at ten listing pages online, what makes your property stand out? Filter 6 scores the structural competitive advantages of the project.
The USP filter synthesizes four key components:
A combined score of 4 to 5 stars indicates strong product differentiation, allowing the owner to command premium rents even during sluggish market conditions.
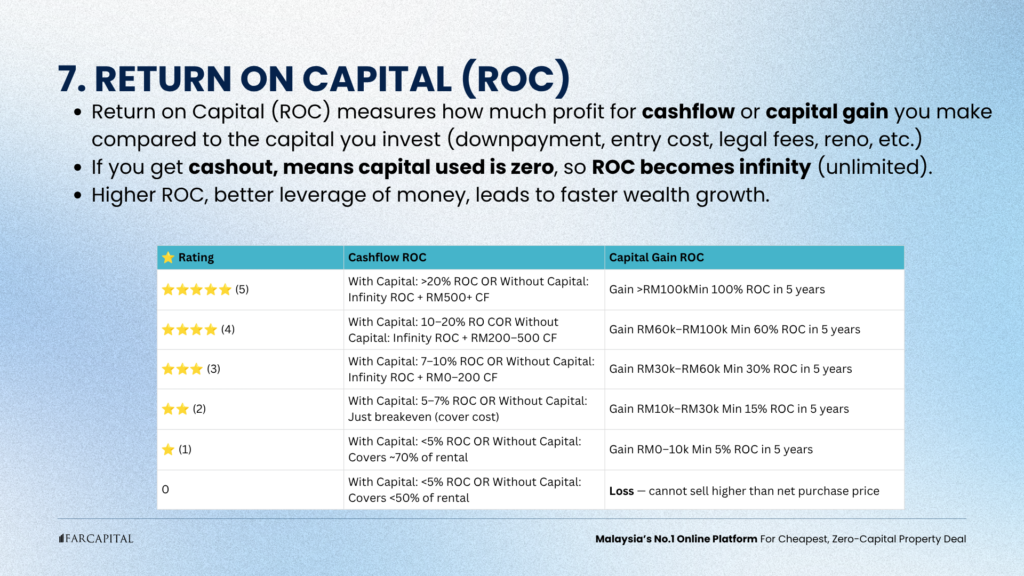
Return on Capital (ROC) measures how efficiently your capital creates wealth. It compares cash return or capital gain relative to money out of pocket (downpayment, legal fees, renovation costs).
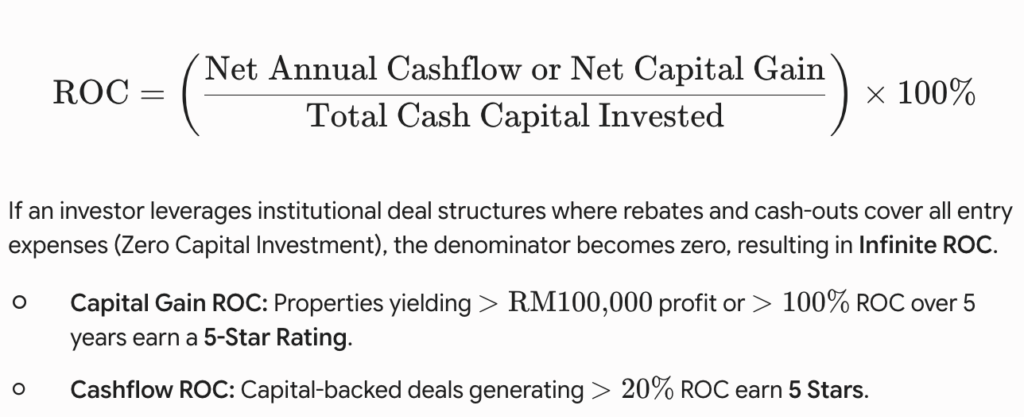
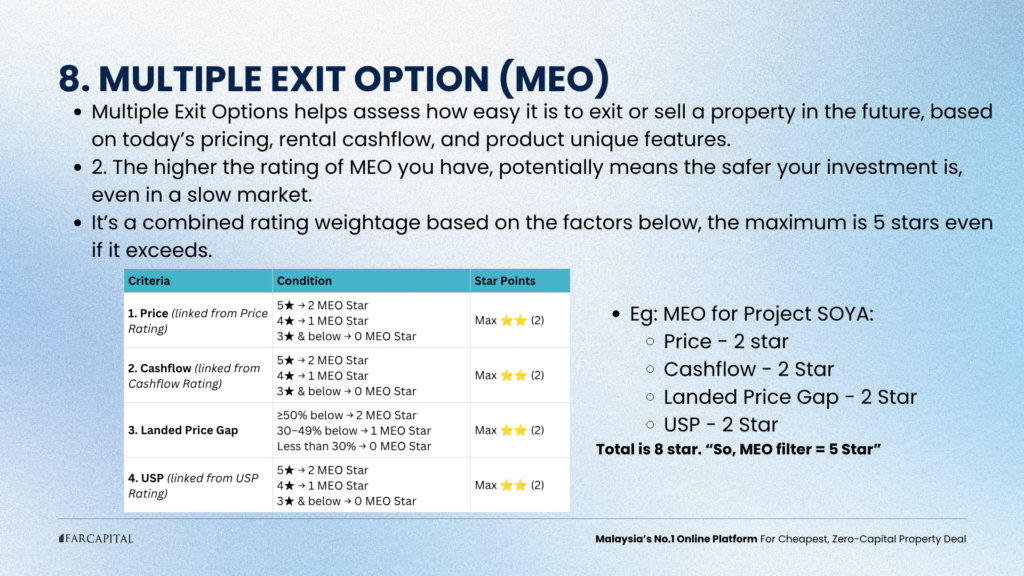
An investment is only as good as your ability to exit. Multiple Exit Options (MEO) evaluate how easily you can liquidate the asset in the future based on entry price, cash flow strength, and product appeal.
MEO aggregates points from four core criteria:
Once all 8 main filters are computed, the project receives two distinct final scores ranging from 0.00 to 5.00 stars: Capital Gain Rating and Cashflow Rating.
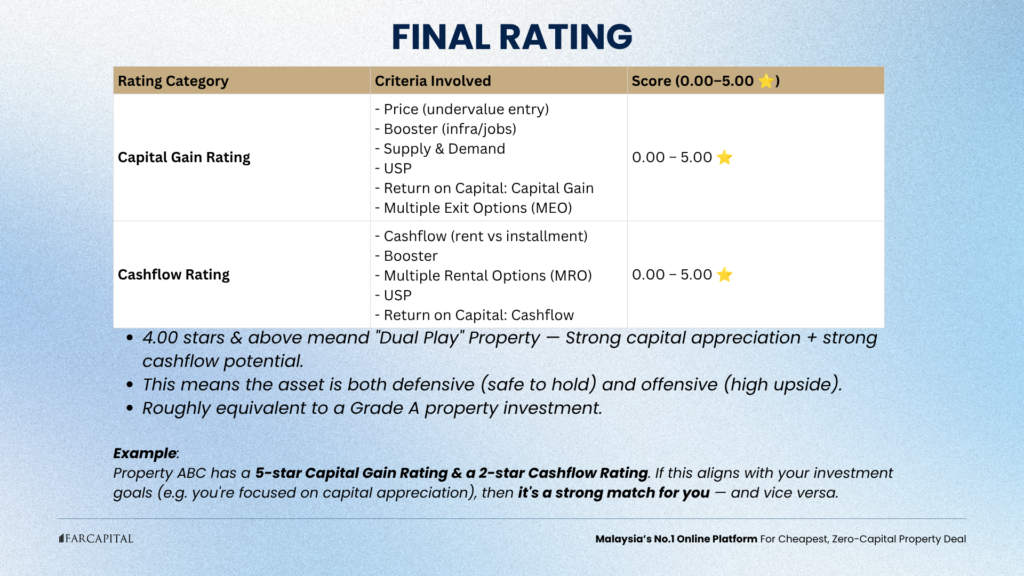
A property that achieves 4.00 Stars & Above in both Capital Gain and Cashflow ratings is classified as a Dual Play Property.
The Dual Play Advantage
- Defensive Capability (Safe to Hold): Strong rental cash flow covers monthly mortgage commitments and holding expenses, ensuring you never face financial distress during economic downturns.
- Offensive Capability (High Upside): Strong economic boosters, supply scarcity, and price undervaluation drive robust long-term capital growth.
Matching your property purchases to your financial status and debt servicing limits is vital. Before taking on new mortgages, review responsible lending guidelines outlined by regulatory bodies such as Bank Negara Malaysia to ensure healthy personal leverage ratios.
The contrast between retail buyers and institutional property communities comes down to process, scale, and objective analytical discipline.
| Evaluation Metric | Retail Individual Buyer | Institutional / Data-Driven Investor |
| Primary Decision Factor | Showroom aesthetics, sales pitch, emotional appeal | 31/8 Property Filter Framework scores |
| Purchase Valuation | Gross developer selling price | Net transacted sub-sale median values |
| Bargaining Power | Zero (Buys single units at retail price) | High (Buys bulk volumes at wholesale prices) |
| Focus Area | Initial zero downpayment rebate tricks | Long-term Cashflow coverage & Return on Capital (ROC) |
| Risk Mitigation | Hope-based holding strategy | Built-in Multiple Exit Options (MEO) |
By stepping back from emotional marketing campaigns and running candidate properties through rigorous evaluation matrices, you protect your capital and build a resilient portfolio.
Buying property is one of the most significant financial commitments you will make. Falling into retail pricing traps drains your cash reserves and locks up your borrowing capacity for years.
To summarize the path toward institutional-grade property investing:
Compare the project’s net per-square-foot (PSF) price after all rebates against the transacted median PSF of 3-to-5-year-old sub-sale properties in the immediate 3-kilometer radius. If the net launch price is higher than existing sub-sale comparables without significantly superior boosters, it is overpriced.
Cash flow gives you holding power. If market appreciation slows down, positive cash flow allows you to hold the property indefinitely without putting pressure on your personal monthly income. Capital gain is a projection, while cash flow is an immediate monthly reality.

